1. Gender
2. Age
3. Income in Dollars ($$)
4. Brand Loyalty (Perceived)
5. Service Quality (Experienced/Perceived)
2. Age
3. Income in Dollars ($$)
4. Brand Loyalty (Perceived)
5. Service Quality (Experienced/Perceived)
First of all, you need to input the above mentioned variables in to SPSS. For details on how to enter/ input the variables in the SPSS please see my previous posts. Once, the variables and values are entered, now you are ready to enter the data.
Once the data is entered in SPSS Data View window, now you are ready to run some descriptive statistics.
In this example, Gender and Age are in coded form for example for Gender values are 1 for male and 2 for female. Similarly, for age, 1 refers to 18-25 years of age, 2 refers to 25.1 to 35 years of age, 3 refers to 35.1 to 45 years of age, and 4 refers to above 45 years of age.
The variable of Income in dollars is entered directly without any coding. The variable of Brand Loyalty is entered via likert scale with 1 refers to very low brand loyalty, 2 refers to low, 3 refers to neutral, 4 refers to high, and 5 refers to very high brand loyalty. The variable of service quality is also based on likert scale with 1 refers to very poor service quality, 2 refers to poor, 3 refers to neutral, 4 refers to good, and 5 refers to very good service quality.
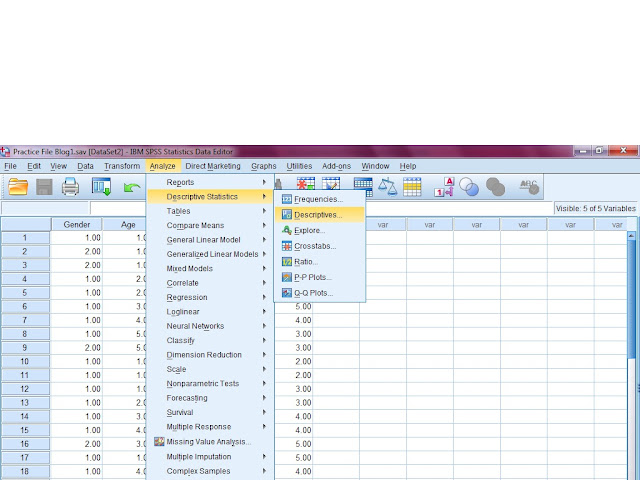
So keeping in view the above variables and their coding/values, now you have entered the data and in position to run basic descriptive statistics. Since, gender and age are categorical in nature and have coding scheme/values; therefore, you can only run the frequencies on these two variables. For this, the command will be as under.
Analyze—Descriptive Statistics—Frequencies, then select the variables and press OK.
A new Output window will appear which will include the output in the forms of tables and charts. You can also copy output tables and charts to MS Word by right click on them and paste them in MS Word which possibly be your article or report. The following tables will appear in output window. Their brief explanation is also given.
The Table Gender shows the number of male and female in the dataset. The frequency column shows that how many male and female are there in the data set so in this case, there are 15 male and 5 female. Similarly, the Percent column shows their frequency in terms of percentage. So there were 75% male and 25% female in the dataset.
The results of Age can also be explained accordingly. The frequency column shows the number of respondents in each age category and Percent column shows their respective percentage.
Besides running simple frequencies, some descriptive statistics can be run by using the following command.
Analyze—Descriptive Statistics---Descriptive- Select the variables and press OK. The output window will provide the following output table.
Analyze—Descriptive Statistics---Descriptive- Select the variables and press OK. The output window will provide the following output table.

In the Descriptive table, the descriptive statistics of three variables namely income, brand loyalty, and service quality are given.
The interpretation for income can be as that minimum income in the dataset or respondents is 1000 while the maximum income is $9000. Similarly, the mean income of all the 20 respondents is $ 4900. As far as brand loyalty is concerned, the value of mean is more meaningful here. The mean value of 3.65 shows that the brand loyalty according to the respondents is just above the neutral point (Compare this value to the 1 to 5 scale already set where 1 refers to very low brand loyalty while 5 refers to very high brand loyalty). The same is the case with service quality which also got the mean value of 3.65 and thus shows that the service quality is also just above the neutral point of 3.
Sample SPSS file is as under.
For details on online SPSS training, please contact on the following.
Email: onlinetrainingsolution@gmail.com
Skype id: faireast1
Ph: +923239256994
Facebook Page: Online Training Solution
Facebook Page Link
Thanks


No comments:
Post a Comment