Showing posts with label faireast. Show all posts

Friday, 30 October 2015

INDEPENDENT SAMPLE T-TEST

In this post, we will be discussing that how independent sample t-test is conducted on SPSS. This test is used when we want to test the hypothesis regarding the means belonging to two separate groups. Lets illustrate this with an example.
Suppose that you are an HR Manager for a large organization and want to find out that if there is some wage differences between male and female salaries. To test this, you can follow the process by developing hypothesis, collecting data, running the independent sample t-test, accepting or rejecting the hypothesis, and then arriving on conclusion.
First you will develop the hypothesis, a sample is as under.
H0 (Null Hypothesis) = There is no differences between the male and female wages in this organization
H1 (Alternative Hypothesis) = There is significant differences between the male and female wages in this organization.Male= 1500, 2500. 3500, 1000, 2500, 1500, 2000, 2000, 2500, 3000 Female= 1000, 1000, 1500, 1000, 2000, 2500, 1500, 1000, 1500, 2000

To test the hypothesis, suppose you collect data from 30 respondents where 15 were male and 15 were female. The data for both groups is as under in US dollars weekly salary.
Now if you calculate simply the average for both groups, you will get average salary of male as US$ 2200, while average salary for female is US$ 1500. However, to test that whether these differences are really significant , you need to run the independent sample t-test.
First input the two variables namely Gender and Wages in US$ and relevant data in SPSS. (For details on how to input the variable and data in to SPSS, Please see my previous posts). 


Once you have setup the variables and data, then you are in position to actually run the test. 

 The command for running the independent sample t-test is as under.
Analyze---Compare Means--- Independent Sample t-test

A dialogue box will appear, where, you will be able to see the both variables.


 First, transfer the Wages variable in to Test Variable box. Then, transfer the Gender variable in to Grouping Variable box and then click on Define Groups. Another dialogue box will appear where simply write 1 and 2 in group 1 and 2 accordingly. Now click on Continue and then on OK. The results will appear in output window which can be interpreted as under.

The first table with the heading ‘Group Statistics’ is simply giving basic information on the mean of both groups. In this example, the average wages for both male and female are shown in this table which shows that for male the average salary is US$ 2200 and for female the average salary is US$ 1500. In next column, there is standard deviation given which is used to judge the measure of dispersion or the variation in the data from its mean point.
In the second table with the heading ‘Independent Samples Test’ there is various statistics given. The value of t and Sig (2-tailed) is used to test the hypothesis. In this example, the value of t is 2.409 which is greater than the standard test value of 2. Similarly, the value of sig is also less than 0.05; therefore, we can reject the null hypothesis and accept the alternative hypothesis. (Hypothesis is normally accepted when Sig value is less than 0.05. It is also called P value)Thus conclusion is that there is significant differences exist between the average salary of male and female in this organization.

Sample Practice File is as under.

For details on Online Classes for SPSS contact the following:
Email: onlinetrainingsolution@gmail.com
Skype Id: faireast1
Mobile: +92-3239256994
Facebook Page: Online Training Solution
Facebook Page Link

Thank You

Monday, 26 October 2015

DESCRIPTIVE STATISTICS USING SPSS

Hello, in this post, I am going to tell you how to run some descriptive statistics in SPSS. Let’s illustrate this with an example. Imagine, you are conducting a survey and collecting data on the following matters of respondents.
1. Gender
2. Age
3. Income in Dollars ($$)
4. Brand Loyalty (Perceived)
5. Service Quality (Experienced/Perceived)
First of all, you need to input the above mentioned variables in to SPSS. For details on how to enter/ input the variables in the SPSS please see my previous posts. Once, the variables and values are entered, now you are ready to enter the data. 


Once the data is entered in SPSS Data View window, now you are ready to run some descriptive statistics.
In this example, Gender and Age are in coded form for example for Gender values are 1 for male and 2 for female. Similarly, for age, 1 refers to 18-25 years of age, 2 refers to 25.1 to 35 years of age, 3 refers to 35.1 to 45 years of age, and 4 refers to above 45 years of age.
The variable of Income in dollars is entered directly without any coding. The variable of Brand Loyalty is entered via likert scale with 1 refers to very low brand loyalty, 2 refers to low, 3 refers to neutral, 4 refers to high, and 5 refers to very high brand loyalty. The variable of service quality is also based on likert scale with 1 refers to very poor service quality, 2 refers to poor, 3 refers to neutral, 4 refers to good, and 5 refers to very good service quality.
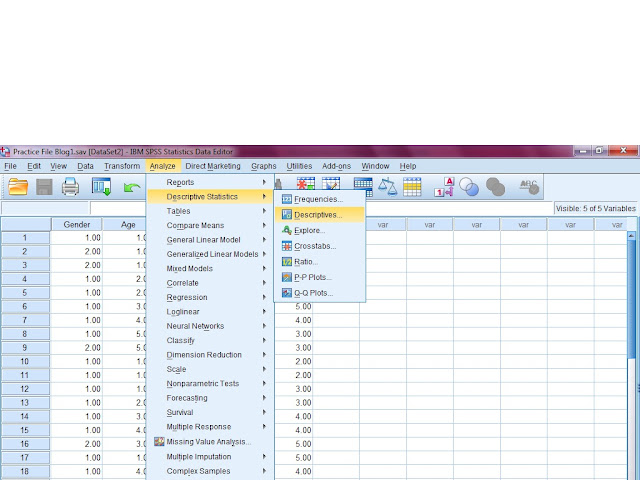
So keeping in view the above variables and their coding/values, now you have entered the data and in position to run basic descriptive statistics. Since, gender and age are categorical in nature and have coding scheme/values; therefore, you can only run the frequencies on these two variables. For this, the command will be as under.
Analyze—Descriptive Statistics—Frequencies, then select the variables and press OK.


A new Output window will appear which will include the output in the forms of tables and charts. You can also copy output tables and charts to MS Word by right click on them and paste them in MS Word which possibly be your article or report. The following tables will appear in output window. Their brief explanation is also given.
 

The Table Gender shows the number of male and female in the dataset. The frequency column shows that how many male and female are there in the data set so in this case, there are 15 male and 5 female. Similarly, the Percent column shows their frequency in terms of percentage. So there were 75% male and 25% female in the dataset.
The results of Age can also be explained accordingly. The frequency column shows the number of respondents in each age category and Percent column shows their respective percentage.
Besides running simple frequencies, some descriptive statistics can be run by using the following command.
Analyze—Descriptive Statistics---Descriptive- Select the variables and press OK. The output window will provide the following output table.


In the Descriptive table, the descriptive statistics of three variables namely income, brand loyalty, and service quality are given.


The interpretation for income can be as that minimum income in the dataset or respondents is 1000 while the maximum income is $9000. Similarly, the mean income of all the 20 respondents is $ 4900. As far as brand loyalty is concerned, the value of mean is more meaningful here. The mean value of 3.65 shows that the brand loyalty according to the respondents is just above the neutral point (Compare this value to the 1 to 5 scale already set where 1 refers to very low brand loyalty while 5 refers to very high brand loyalty). The same is the case with service quality which also got the mean value of 3.65 and thus shows that the service quality is also just above the neutral point of 3.

Sample SPSS file is as under.

For details on online SPSS training, please contact on the following.
Email: onlinetrainingsolution@gmail.com
Skype id: faireast1
Ph: +923239256994
Facebook Page: Online Training Solution
Facebook Page Link

Thanks

Sunday, 25 October 2015

CREATING VARIABLES IN SPSS

In this post, we will be discussing that how one can create a variable in SPSS. The reason for creating a new variable is that often in Social Sciences, we have a variable which we measure through using a specific instrument/questionnaire which contain more than one question. All questions in a specific instrument/questionnaire represents the same variable for example 'Service Quality' is a variable measured by 21 set of questions developed by a specialist. Job satisfaction is measured by 3 items. Emotional intelligence is measured by 10 statement questionnaire. As all the questions/statements represents same variable, therefore, we need to calculate one variable out of those questions/statements belonging to one variable. For more clarification, consider the following example.
A questionnaire/instrument is developed by Cammann et al.(1983 to measure the concept of 'Job Satisfaction'. The said instrument is as under.
Job satisfaction
1. All in all, I am satisfied with my job.
2. In general, I like my job
3. In general, I like working here.
The above questionnaire is used to measure the respondents response about their job satisfaction. Lets say that you have input all these statements as individual variables in SPSS-Variable View Window. (Consider screenshot  for clarification)


Now you have entered the variables and their respective values in the 'variable view' so now you are in position to start entering the data.


So you have put the data for 20 respondents for the three statements referring to 'Job satisfaction' concept. Now you want to calculate the variable by averaging the responses, so perform the following command.
Transform----Compute Variable
In Target variable, write the name of the variable i.e. Job Satisfaction. Then in right side, select the function group--Statistical--and in Functions and special Variables--Mean


Now in Numeric Expression box, Mean will appear along with brackets. Now click on each statement given in left hand side and drag them to those brackets and make sure that all three statements are separated by commas and closed by brackets.


Now click on OK button and go to the 'Data View'. Here you will find a newly created variable along with its average/mean values.


By using the same 'Data Transformation' option, we can also create other variables with some other functions like Summation, Maximum and so on.
So that's it for Data Transformation/ Creating variables in SPSS. For more details, view my other posts.

For details on SPSS online course at economical fee, please contact on the following.
Email: onlinetrainingsolution@gmail.com
Skype ID: faireast1
Phone: +923239256994
Facebook Page: Online Training Solution
Facebook LInk
Regards

ENTERING VARIABLE AND DATA IN TO SPSS

INPUTTING THE VARIABLES IN TO SPSS
Before any data analysis can be performed, you have to do a bit of programming in SPSS so that it can understand your research requirements, variables of interest, data nature and so on.Therefore, lets review some common issues first.
A variable is anything which vary from one unit of analysis to another. Variables are of three main type i.e. nominal, ordinal, and scale
Nominal variable is used when data is of only qualitative/ identification purpose e.g. gender, nationality, religion etc.
Ordinal variable is used when there is some order in data e.g. age, income, salary etc.
Scale is used when data is quantitative in nature. Most of the social sciences research use Likert scale which can also be categorized as Scale data.
when possible, we use the scale data preferably, as it allows us to perform more advanced statistical test while the test performed on nominal data are different from those of performed on scale data.
We start with an example. Lets say you want to enter the following variables/questions in your SPSS.
1. Gender.
2. Age
3. Income
4. Brand Loyalty
Before we put the following variables, lets assume that you have developed the following options for the above mentioned questions which can be conveniently entered in SPSS.
1. Gender
a. Male
b. Female
c. Others
2. Age
a. 18-25,
b.25.1-35
c.35.1-45
d.45 and above
3. Income
a. $1000 and less
b. $1001-5000
c.$5001-10000
d. Above 10000
4. Brand Loyalty
a. Very low
b. Low
c. Neutral
d. High
e. Very High
5. Service Quality
a. Very Poor
b. Poor
c. Neutral
d. Good
e. Very Good
Now lets enter the above mentioned variables along with their options in the SPSS. Start SPSS and come to the Variable View window (See Picture 1)

Once you have arrived in SPSS Variable view, now you are in position to start entering Variables and their respective options in SPSS. In name column, write the name of the question (Keep in mind that SPSS dont allow space), so write a small or short form of question. You can write the full description or name of the variables along with space in the fifth column name Label. If you want to change the nature of the data, then you can click on the second column-select option such as string for alphabet characters, or date for date related data. In Values column, You can enter the answer options one by one by the following manner (See Picture 2 ).


Put 1 in Value and Male in Label and press enter. Similarly, put 2 for second option (Female), 3 for third option (Others). 

This way you can put all the andr options one by one. After you have entered all the variables, your screen should looks like the following

Now if you click on the 'Data View' button at the bottom of screen, you will be able to see the Gender name in the top of the column.

Now you are in position to start entering the data as per the coding you assigned. One row in the data view represents the data of one unit so for example one person filled the form as Male, 18-25 years of age, 1001-3000 $ income, Neutral brand loyalty, and High Service Quality. You will enter the following codes
1= Male
1=18-25 Years of age
2=1001-3000 $ income
3= Neutral
5= High Service Quality
Again remember that in Data View, one row represents the responses of all the questions/variables for only one unit/person/respondent. For next unit/person/respondent, you will input coded data in second row. Therefore, the number of rows should always be equal to the number of unit/person/respondent so for example in case of 50 unit/person/respondents you will have 50 rows filled in this 'Data View' screen.

A SPSS sample file related to the above example is given here

For other topics or next stages of SPSS, see my next posts.

For details on SPSS online course at economical fee, please contact on the following.
Email: onlinetrainingsolution@gmail.com
Skype ID: faireast1
Phone: +923239256994
Facebook: Online Training Solution 
Facebook Page

Regards


STARTING WITH SPSS

INTRODUCTION TO SPSS
A starting point to understand SPSS is to read some material related to research. You can read a simple book such as Research Methods. SPSS learning can be divided in to three steps.
1st step is to learn about Variable feeding/ Questionnaire input. In this stage, you program SPSS about your research questionnaire or instrument.
2nd Stage is Data input where you input your data collected through questionnaire or some other source of observation.
3rd Stage is the most complicated one as in this stage you analyze the data by using relevant statistical techniques such as correlation, regression, etc. After conducting the analysis, next you copy the results in to your report/thesis/dissertation and interpret the results.
Quantitative techniques and software such as SPSS are research tools, main thing is that you configure your research topic, research questions, and hypothesis right.
For example, if you want to design a simple research, lets say you set your topic to be descriptive, then you will also design research questions in descriptive form, and then hypothesis also on descriptive format and same process for casual and comparative research
So the key points are:
First select the topic---- then design the research questions--- then design the research objectives---- then develop hypothesis-- Collect the data-- run the tests--- get the results---conclusions-- Writing the Research Report
Learning SPSS consist of different steps. Lets review each step one by one. Once you start the SPSS, click on 'type in data' and then 'OK'


Now you will arrive to the main SPSS window. In this screen at the bottom, you will seen two buttons. 


One button says 'Data View' and other 'Variable View'. In 'Variable view' you can enter the variables of your study while in 'Data view' you can input the data. Starters should click on 'Variable view' so that first input the variables of the study while in second stage, data can be entered in SPSS.


 For details on SPSS online courses at economical fee, please contact on the following:
Email: onlinetrainingsolution@gmail.com
Skype ID: faireast1
Phone: +923239256994
Facebook Page: Online Training Solution
Online Training Solution Facebook Page

Regards

SPSS COURSE INTRODUCTION

SPSS COURSE
SPSS refers to the ‘Statistical Package for the Social Sciences’ is a widely used software for statistical analysis and data handling in social sciences. Personal One to One training is available at economical fee. 
Registration Form is as under:
Registration Form for SPSS Online Course

For more details contact:
Email: onlinetrainingsolution@gmail.com
Skype Id: faireast1
Mobile: +92-3239256994
Facebook Page: Online Training Solution 
Online Training Solution Facebook Page